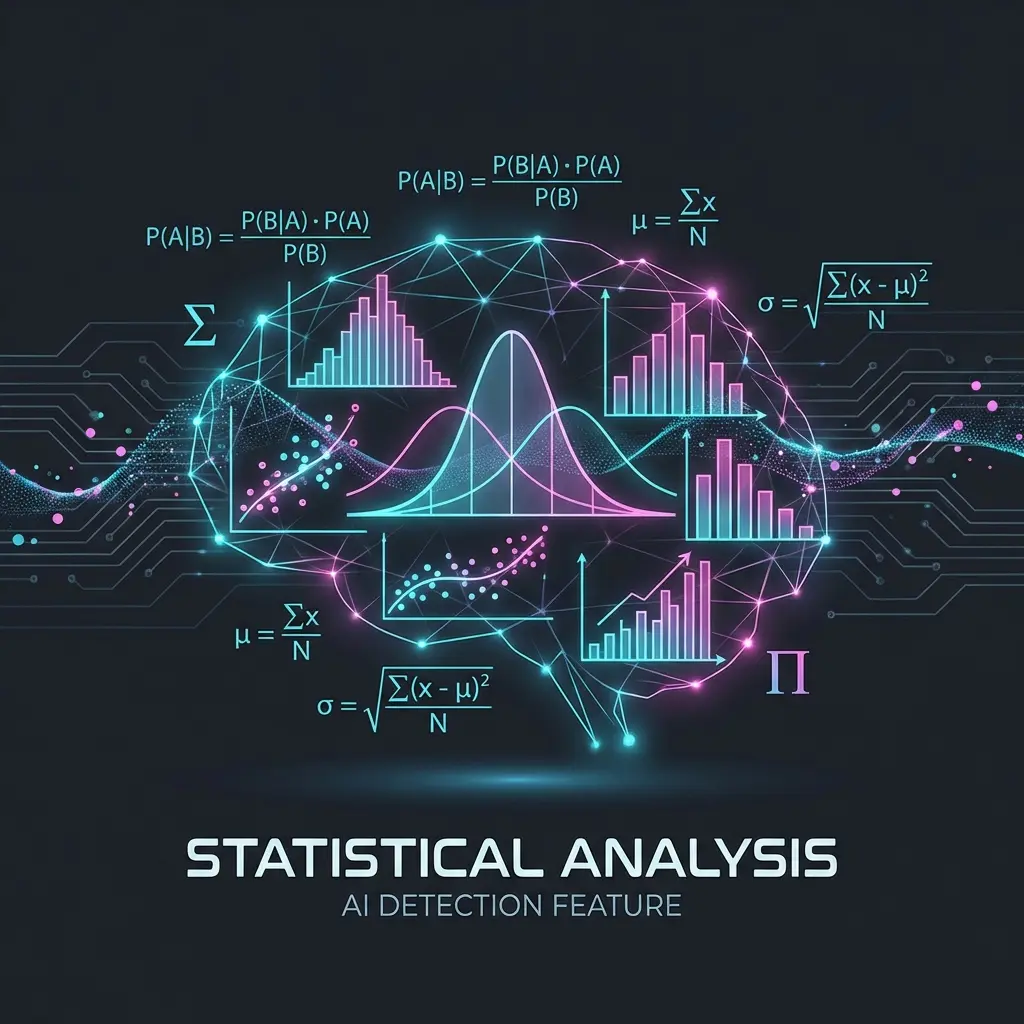
Statistical Pattern Analysis
Entropy & Benford's Law
Analyzes statistical properties including Shannon entropy, histogram patterns, and Benford's Law compliance to detect synthetic image characteristics.
Frequently Asked Questions
What is image entropy?
Entropy measures information content based on pixel value distribution. Natural images have specific entropy ranges; AI images often have abnormally high or low entropy.
How does Benford's Law apply to images?
Benford's Law describes the expected frequency of leading digits in natural data. Real DCT coefficients follow this distribution; AI-generated images often deviate from it.
What is histogram analysis?
Analyzing the distribution of pixel values. Real photos have smooth histograms shaped by scene content; AI images may have gaps, spikes, or unusual symmetry.
What is spatial autocorrelation?
This measures how pixel values correlate with neighbors. Real images from sensors have specific correlation patterns; AI generation creates different spatial relationships.
Why are statistics different for AI?
AI generates images through mathematical processes that create detectable patterns. Even when visually perfect, statistical fingerprints remain different from camera output.
Can editing change statistics enough?
Editing affects statistics, which is why this method has lower weight. Heavy editing can normalize AI statistics, but typically introduces other detectable artifacts.
What are first-digit frequencies?
Benford's Law predicts ~30% of first digits should be "1", ~17% "2", etc. AI DCT coefficients often show flatter distributions not matching these natural ratios.
Is this method standalone effective?
Statistical analysis alone has 70-80% accuracy. It works best combined with other methods, providing additional signal especially when visual analysis is uncertain.
What image regions are analyzed?
Both global statistics and local patch statistics are computed. AI images often show suspicious uniformity of statistics across patches that would naturally vary.
Does resolution affect accuracy?
Higher resolution provides more data for reliable statistics. Very small images may not have enough samples for accurate Benford analysis; minimum 256x256 is recommended.
相关方法
机器学习检测
我们的机器学习检测使用最先进的Transformer模型,在数百万张图像上训练,以区分真实照片和AI生成内容。
PRNU分析
光响应非均匀性(PRNU)检测来自制造缺陷的独特相机传感器指纹。AI图像无法复制这些真实的传感器签名。
频率分析
频域分析检查图像中高频和低频分量的分布。AI生成的图像通常缺乏真实照片中存在的自然高频噪声。
梯度分析
使用Sobel、Canny和Laplacian算子分析边缘模式和纹理特征。AI图像通常具有不自然平滑或均匀的梯度。
噪声模式
真实照片包含来自相机传感器的独特噪声模式,这些模式在图像中有所不同。AI生成的图像具有不自然的均匀噪声分布。
元数据分析
图像元数据包含关于其来源的重要线索。我们分析EXIF数据、软件签名和其他嵌入信息以识别AI生成工具。
GAN指纹
检测GAN特有的伪影,如棋盘格图案、色带和生成对抗网络特有的频谱异常。
纹理分析
局部二值模式分析用于检测AI生成图像中常见的纹理异常。测量均匀性、熵和同质性。
人体解剖检测
AI图像生成器经常创建人类立即识别为错误的解剖错误。我们使用计算机视觉来检测这些明显的错误。
C2PA验证
C2PA是通过加密签名跟踪数字内容来源和历史的行业标准。
Semantic Inconsistency Detection
Detects logical inconsistencies like incorrect shadows, impossible perspectives, distorted reflections, and violations of physical laws that AI often produces.
Human Biometric Analysis
Uses MediaPipe to analyze human anatomy for incorrect finger counts, asymmetric eyes, unnatural skin texture, and other anatomical anomalies common in AI-generated faces.
Lighting Physics Validation
Validates light source consistency, shadow direction physics, specular highlight accuracy, and color temperature uniformity across the image.
Compression Artifact Analysis
Analyzes JPEG compression artifacts to estimate quality levels and detect re-compression patterns that indicate image manipulation or AI generation.
Edge Sharpness Analysis
Analyzes sharpness distribution across the image and validates depth-of-field consistency. AI often produces unnaturally uniform sharpness.
Chromatic Aberration Analysis
Detects the absence of chromatic aberration (color fringing) that real camera lenses produce. AI images lack these optical artifacts.
Micro-Texture Analysis
Analyzes microscopic texture patterns for repetition, uniformity, and unnatural randomness that AI generators often exhibit.
Color Palette Analysis
Analyzes color distribution including saturation levels, color diversity, and white balance consistency. AI images often have oversaturated colors.