频率分析
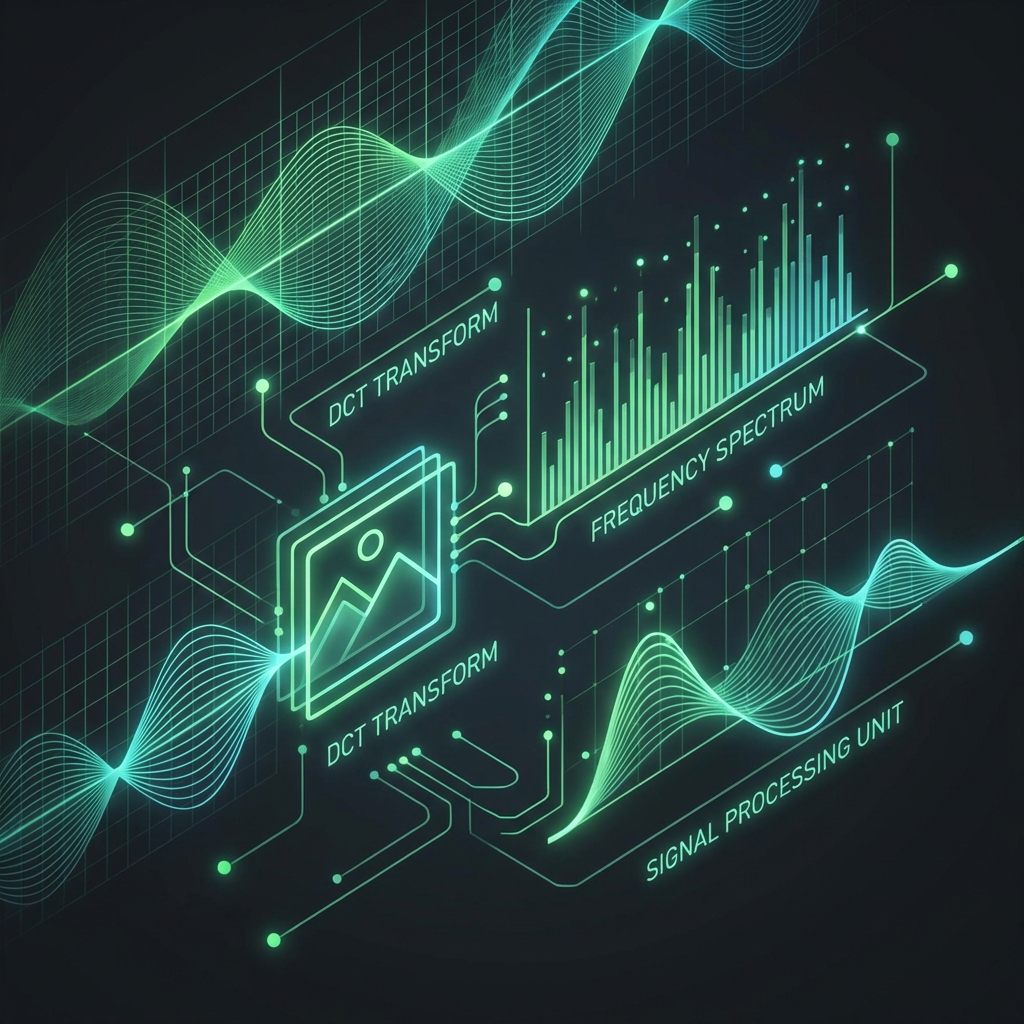
DCT频谱分析
频域分析检查图像中高频和低频分量的分布。AI生成的图像通常缺乏真实照片中存在的自然高频噪声。
How It Works
Using Discrete Cosine Transform (DCT), we decompose the image into its frequency components. Real photographs contain rich high-frequency detail from camera sensors, while AI images tend to be smoother with less high-frequency energy.
Real Photos
- • Rich high-frequency content
- • Natural camera sensor noise
- • Sharp edges and details
- • High_freq_ratio > 0.20
AI Generated
- • Smooth, low-frequency dominant
- • Uniform synthetic patterns
- • Blurry fine details
- • High_freq_ratio < 0.15
Technical Implementation
DCT (Discrete Cosine Transform)
We decompose images into frequency components using 2D DCT, then analyze the energy distribution between high and low frequency regions.
Frequently Asked Questions
What is frequency analysis for AI detection?
Frequency analysis uses DCT (Discrete Cosine Transform) to decompose images into frequency components. AI images typically lack the high-frequency detail found in real photographs.
Why do AI images lack high frequencies?
AI diffusion models generate images at lower resolutions and upsample them. This process smooths out fine details, reducing high-frequency content compared to sensor-captured photos.
What is the high-frequency ratio threshold?
Real photos typically have a high-frequency ratio above 0.20. AI-generated images often fall below 0.15, indicating their synthetic smooth nature.
How is the DCT applied?
We convert images to grayscale, apply 2D DCT, and separate the spectrum into low and high frequency regions. The ratio of energy in these regions indicates image origin.
Does image sharpening affect results?
Artificial sharpening can boost high frequencies, but the pattern differs from natural sensor noise. Our analysis considers both ratio and distribution characteristics.
Why is frequency analysis weighted at 20%?
Frequency analysis is highly reliable for detecting diffusion models but can be affected by image filters. The 20% weight reflects its strong but not absolute discriminative power.
What's the difference from FFT analysis?
DCT produces only real values (no complex numbers) and has better energy compaction for image signals. It's also what JPEG compression uses, making it well-suited for forensics.
Can upscaled AI images fool this?
AI upscalers add synthetic high-frequency detail, but these patterns are uniform and lack the natural variation of camera-captured fine detail. Detection remains effective.
What image size is optimal?
We process images at 512x512 maximum for analysis. Higher resolution provides more frequency data, but the ratios remain consistent across sizes.
Does this work on all AI generators?
Frequency analysis is particularly effective against diffusion models (DALL-E, Midjourney, Stable Diffusion). Older GAN-based generators show different but still detectable patterns.
相关方法
机器学习检测
我们的机器学习检测使用最先进的Transformer模型,在数百万张图像上训练,以区分真实照片和AI生成内容。
PRNU分析
光响应非均匀性(PRNU)检测来自制造缺陷的独特相机传感器指纹。AI图像无法复制这些真实的传感器签名。
梯度分析
使用Sobel、Canny和Laplacian算子分析边缘模式和纹理特征。AI图像通常具有不自然平滑或均匀的梯度。
噪声模式
真实照片包含来自相机传感器的独特噪声模式,这些模式在图像中有所不同。AI生成的图像具有不自然的均匀噪声分布。
元数据分析
图像元数据包含关于其来源的重要线索。我们分析EXIF数据、软件签名和其他嵌入信息以识别AI生成工具。
GAN指纹
检测GAN特有的伪影,如棋盘格图案、色带和生成对抗网络特有的频谱异常。
纹理分析
局部二值模式分析用于检测AI生成图像中常见的纹理异常。测量均匀性、熵和同质性。
人体解剖检测
AI图像生成器经常创建人类立即识别为错误的解剖错误。我们使用计算机视觉来检测这些明显的错误。
C2PA验证
C2PA是通过加密签名跟踪数字内容来源和历史的行业标准。
Semantic Inconsistency Detection
Detects logical inconsistencies like incorrect shadows, impossible perspectives, distorted reflections, and violations of physical laws that AI often produces.
Human Biometric Analysis
Uses MediaPipe to analyze human anatomy for incorrect finger counts, asymmetric eyes, unnatural skin texture, and other anatomical anomalies common in AI-generated faces.
Lighting Physics Validation
Validates light source consistency, shadow direction physics, specular highlight accuracy, and color temperature uniformity across the image.
Compression Artifact Analysis
Analyzes JPEG compression artifacts to estimate quality levels and detect re-compression patterns that indicate image manipulation or AI generation.
Edge Sharpness Analysis
Analyzes sharpness distribution across the image and validates depth-of-field consistency. AI often produces unnaturally uniform sharpness.
Statistical Pattern Analysis
Analyzes statistical properties including Shannon entropy, histogram patterns, and Benford's Law compliance to detect synthetic image characteristics.
Chromatic Aberration Analysis
Detects the absence of chromatic aberration (color fringing) that real camera lenses produce. AI images lack these optical artifacts.
Micro-Texture Analysis
Analyzes microscopic texture patterns for repetition, uniformity, and unnatural randomness that AI generators often exhibit.
Color Palette Analysis
Analyzes color distribution including saturation levels, color diversity, and white balance consistency. AI images often have oversaturated colors.