Análisis de Frecuencia
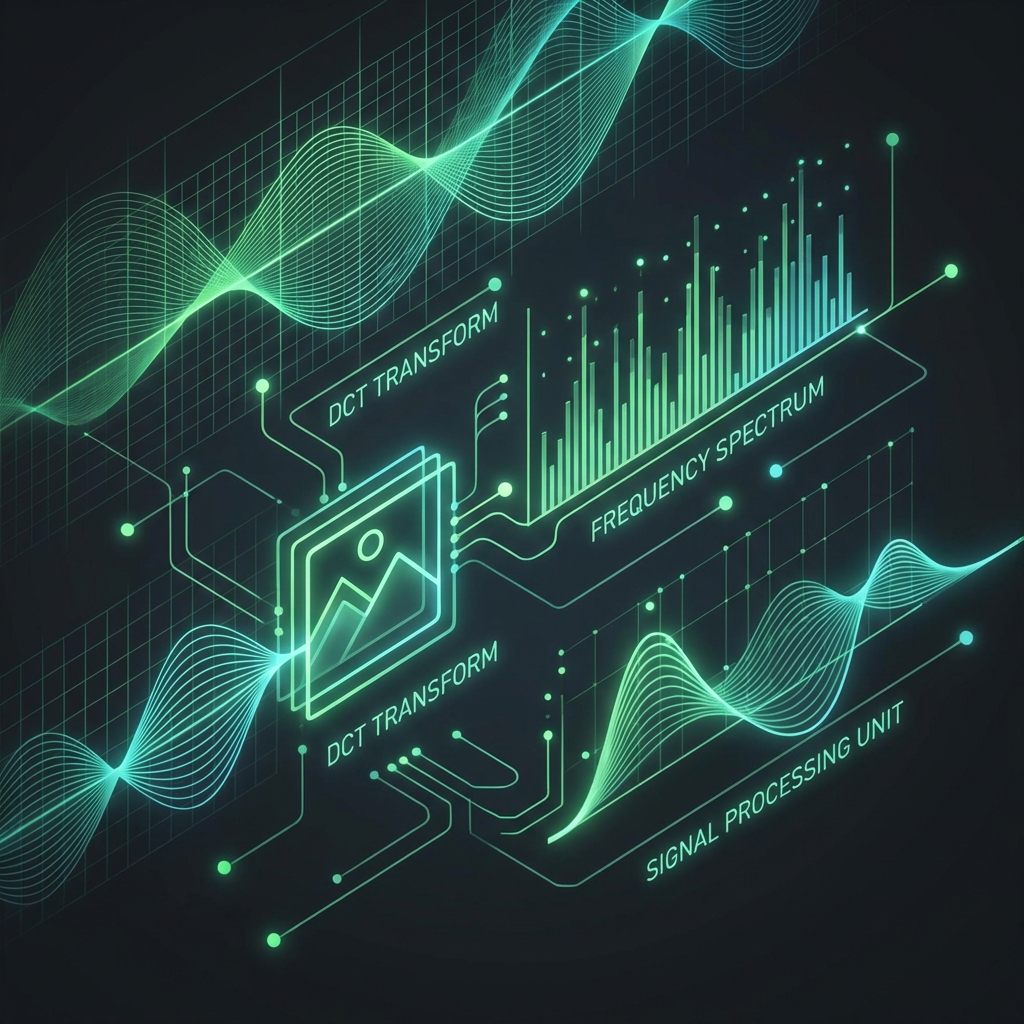
Análisis de Espectro DCT
El análisis del dominio de frecuencia examina la distribución de componentes de alta y baja frecuencia en una imagen. Las imágenes generadas por IA típicamente carecen del ruido natural de alta frecuencia presente en fotografías reales.
Cómo Funciona
Usando la Transformada de Coseno Discreta (DCT), descomponemos la imagen en sus componentes de frecuencia. Las fotografías reales contienen ricos detalles de alta frecuencia de los sensores de cámara, mientras que las imágenes de IA tienden a ser más suaves.
Real Photos
- • Rich high-frequency content
- • Natural camera sensor noise
- • Sharp edges and details
- • High_freq_ratio > 0.20
AI Generated
- • Smooth, low-frequency dominant
- • Uniform synthetic patterns
- • Blurry fine details
- • High_freq_ratio < 0.15
Technical Implementation
DCT (Discrete Cosine Transform)
We decompose images into frequency components using 2D DCT, then analyze the energy distribution between high and low frequency regions.
Frequently Asked Questions
What is frequency analysis for AI detection?
Frequency analysis uses DCT (Discrete Cosine Transform) to decompose images into frequency components. AI images typically lack the high-frequency detail found in real photographs.
Why do AI images lack high frequencies?
AI diffusion models generate images at lower resolutions and upsample them. This process smooths out fine details, reducing high-frequency content compared to sensor-captured photos.
What is the high-frequency ratio threshold?
Real photos typically have a high-frequency ratio above 0.20. AI-generated images often fall below 0.15, indicating their synthetic smooth nature.
How is the DCT applied?
We convert images to grayscale, apply 2D DCT, and separate the spectrum into low and high frequency regions. The ratio of energy in these regions indicates image origin.
Does image sharpening affect results?
Artificial sharpening can boost high frequencies, but the pattern differs from natural sensor noise. Our analysis considers both ratio and distribution characteristics.
Why is frequency analysis weighted at 20%?
Frequency analysis is highly reliable for detecting diffusion models but can be affected by image filters. The 20% weight reflects its strong but not absolute discriminative power.
What's the difference from FFT analysis?
DCT produces only real values (no complex numbers) and has better energy compaction for image signals. It's also what JPEG compression uses, making it well-suited for forensics.
Can upscaled AI images fool this?
AI upscalers add synthetic high-frequency detail, but these patterns are uniform and lack the natural variation of camera-captured fine detail. Detection remains effective.
What image size is optimal?
We process images at 512x512 maximum for analysis. Higher resolution provides more frequency data, but the ratios remain consistent across sizes.
Does this work on all AI generators?
Frequency analysis is particularly effective against diffusion models (DALL-E, Midjourney, Stable Diffusion). Older GAN-based generators show different but still detectable patterns.
Métodos relacionados
Detección ML
Nuestra detección ML usa modelos Transformer entrenados en millones de imágenes.
Análisis PRNU
Photo Response Non-Uniformity (PRNU) detects unique camera sensor fingerprints from manufacturing imperfections. AI images cannot replicate these authentic sensor signatures.
Análisis de gradiente
Analyzes edge patterns and texture characteristics using Sobel, Canny, and Laplacian operators. AI images often have unnaturally smooth or uniform gradients.
Patrón de ruido
Las fotografías reales contienen patrones de ruido únicos de los sensores de cámara que varían a través de la imagen. Las imágenes generadas por IA tienen una distribución de ruido anormalmente uniforme.
Análisis de metadatos
Los metadatos de imagen contienen pistas valiosas sobre su origen. Analizamos datos EXIF, firmas de software y otra información incrustada para identificar herramientas de generación de IA.
Huella GAN
Detecta artefactos específicos de GAN como patrones de tablero de ajedrez y bandas de color.
Análisis de textura
Análisis Local Binary Pattern para anomalías de textura en imágenes IA.
Detección Anatómica
Los generadores de imágenes de IA a menudo crean errores anatómicos que los humanos reconocen inmediatamente como incorrectos. Usamos visión por computadora para detectar estos errores reveladores.
Verificación C2PA
C2PA (Coalition for Content Provenance and Authenticity) es un estándar de la industria para rastrear el origen y la historia del contenido digital a través de firmas criptográficas.
Semantic Inconsistency Detection
Detects logical inconsistencies like incorrect shadows, impossible perspectives, distorted reflections, and violations of physical laws that AI often produces.
Human Biometric Analysis
Uses MediaPipe to analyze human anatomy for incorrect finger counts, asymmetric eyes, unnatural skin texture, and other anatomical anomalies common in AI-generated faces.
Lighting Physics Validation
Validates light source consistency, shadow direction physics, specular highlight accuracy, and color temperature uniformity across the image.
Compression Artifact Analysis
Analyzes JPEG compression artifacts to estimate quality levels and detect re-compression patterns that indicate image manipulation or AI generation.
Edge Sharpness Analysis
Analyzes sharpness distribution across the image and validates depth-of-field consistency. AI often produces unnaturally uniform sharpness.
Statistical Pattern Analysis
Analyzes statistical properties including Shannon entropy, histogram patterns, and Benford's Law compliance to detect synthetic image characteristics.
Chromatic Aberration Analysis
Detects the absence of chromatic aberration (color fringing) that real camera lenses produce. AI images lack these optical artifacts.
Micro-Texture Analysis
Analyzes microscopic texture patterns for repetition, uniformity, and unnatural randomness that AI generators often exhibit.
Color Palette Analysis
Analyzes color distribution including saturation levels, color diversity, and white balance consistency. AI images often have oversaturated colors.
Verificar Tu Imagen
Todos los métodos se combinan usando puntuación ponderada para producir un veredicto final con nivel de confianza.
Probar Ahora